2024-09-22 Node debuging using Chrome Dev Tools
Recently working on a node script I wanted to debug it. Node has a built in debugger.
node inspect wait.js
< Debugger listening on ws://127.0.0.1:9229/ffda2d5f-9a2a-4162-8aaf-cffcf8ed4f6d
< For help, see:
https://nodejs.org/en/docs/inspector
<
connecting to 127.0.0.1:9229 ... ok
< Debugger attached.
<
Break on start in wait.js:9
  7 }
  8
> 9 console.log('before');
 10 wait(7000);  //7 seconds in milliseconds
 11 console.log('after');
debug>
The debugger is fine but can be hard to grasp.
There is an alternative way of debugging using your chrome browser.
If you want to use chrome dev tools to debug the tests you can do as follows:
Launch chrome browser and go to chrome://inspect
There should be an option for connections, I found on my chromebook that localhost:nnnn was blocked in some way and so I had to set it up as 127.0.0.1:9229
Then go to the source of you script and type:
node --inspect-brk wait.js
Debugger listening on ws://127.0.0.1:9229/ce0bc4d3-7285-4e00-80dd-d7126e9a9dd2
For help, see:
https://nodejs.org/en/docs/inspector
Debugger attached.
The key here is the --inspect-brk the -brk on the end causes the script to stop as soon as it starts allowing you to debug it.
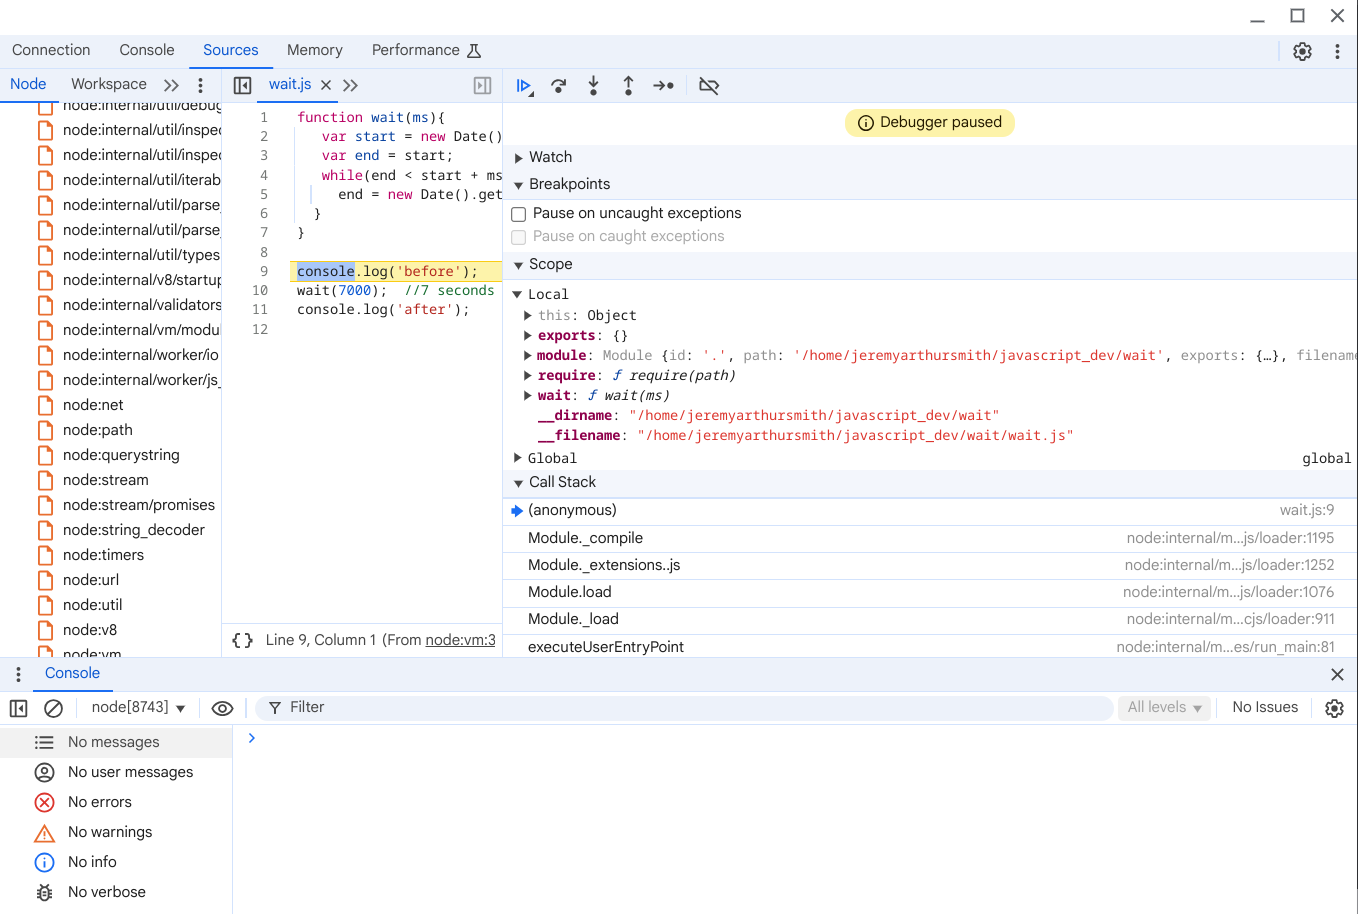
Hopefully a debugging window will pop up
(ignore the code it was just something I grabbed without looking at it)